Industry News
Markets
2021 already a record year for Canadian home sales
November 16, 2021 By Canadian Real Estate Association
Statistics released today by the Canadian Real Estate Association (CREA) show national home sales have already set a new annual record in 2021.
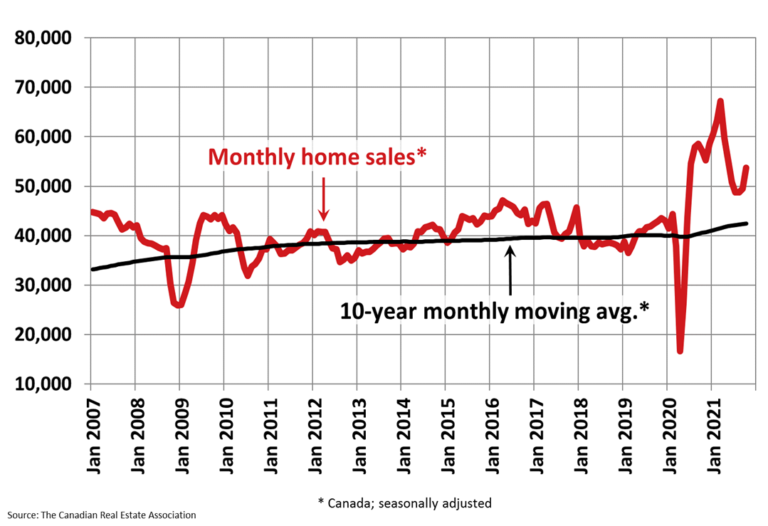
Home sales recorded over Canadian MLS Systems were up 8.6% between September and October 2021, marking the largest month-over-month increase since July 2020.
Sales were up month over month in about three-quarters of all local markets, and in all major cities.
The actual (not seasonally adjusted) number of transactions in October 2021 was down 11.5% on a year-over-year basis from the record for that month set last year. That said, it was still the second-highest ever October sales figure by a sizeable margin.
On a year-to-date basis, some 581,275 residential properties traded hands via Canadian MLS Systems from January to October 2021, surpassing the annual record of 552,423 sales for all of 2020.
“After a summer where it looked like housing markets might be calming down a bit, October’s numbers suggest we might be moving back towards what we saw this Spring, with regards to current market demand and supply conditions,” said Cliff Stevenson, chair of CREA. “That said, one month of data is not a trend, so we’ll be watching how the balance of this memorable year plays out closely. And remember, in what is still a rapidly changing landscape, your local realtor can provide much more granular and timely information and guidance about what is going on in the neighbourhoods where you live or where you might like to in the future,” continued Stevenson.
“2021 continues to surprise. Sales beat last year’s annual record by about Thanksgiving weekend so that was always a lock, but I don’t think too many observers would have guessed the monthly trend would be moving up again heading into 2022,” said Shaun Cathcart, CREA’s senior economist. “A month with more new listings is what allows for more sales because those listings are mostly all still getting gobbled up; however, with demand that strong, the supply of homes for sale at any given point in time continues to shrink. It is at its lowest point on record right now, which is why it’s not surprising prices are also re-accelerating. We need to build more housing.”
The number of newly listed homes rose by 3.2% in October compared to September, driven by gains in about 70% of local markets. With so many markets starved for supply, it’s not surprising to see sales go up in months when more properties go up for sale.
With sales up by more than new listings in October, the sales-to-new listings ratio tightened again to 79.5% compared to 75.5% in September and 73.5% in August. The long-term average for the national sales-to-new listings ratio is 54.8%.
Based on a comparison of sales-to-new listings ratio with long-term averages, more markets have been moving back into seller’s market territory this fall. As of October, about two-thirds of local markets were seller’s markets based on the sales-to-new listings ratio being more than one standard deviation above its long-term mean.
There were just 1.9 months of inventory on a national basis at the end of October 2021, down almost half a month from three months earlier and back in line with the all-time lows recorded in February and March of this year. The long-term average for this measure is more than 5 months.
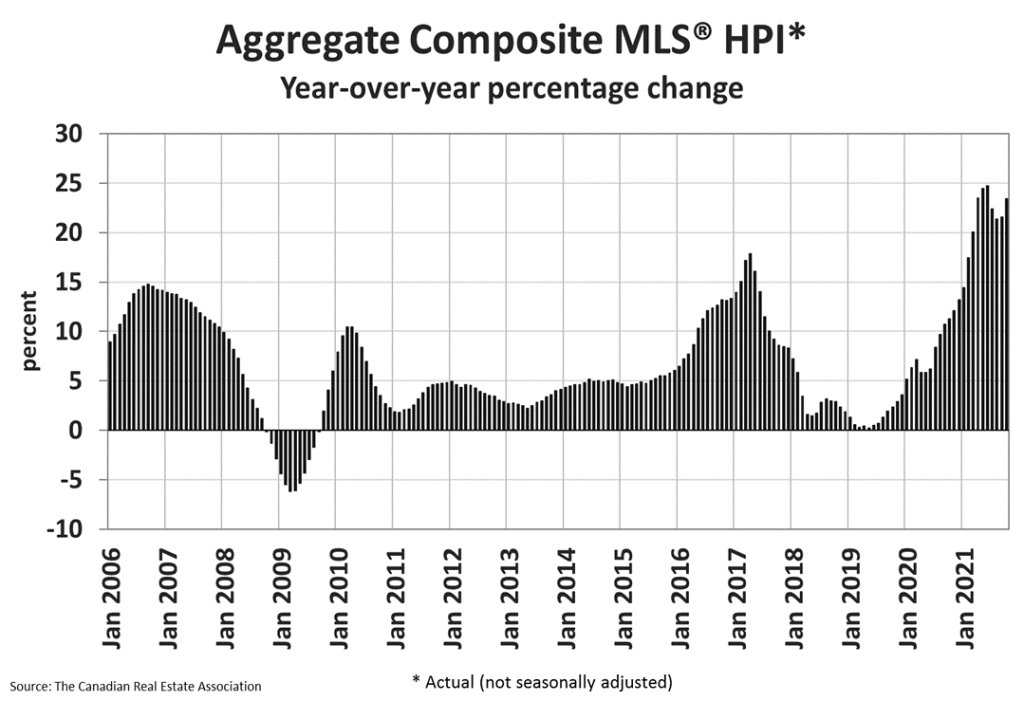
In line with some of the tightest market conditions ever recorded, the Aggregate Composite MLS Home Price Index (MLS HPI) accelerated to 2.7% on a month-over-month basis in October 2021. This trend has been quite broad-based with most parts of the country participating.
The non-seasonally adjusted Aggregate Composite MLS HPI was up 23.4% on a year-over-year basis in October, a larger gain than in the three previous months.
Looking across the country, year-over-year price growth has crept back up above 20% in B.C., though it is lower in Vancouver, on par with the provincial number in Victoria, and higher in other parts of the province.
Year-over-year price gains are in the mid-to-high single digits in Alberta and Saskatchewan, while gains are currently at about 10% in Manitoba.
Ontario saw year-over-year price growth closing in on 30% in October with GTA really surging forward. Greater Montreal’s year-over-year price growth remains at a little over 20%, while Quebec City is now at 13%.
Price growth is running a little above 30% in New Brunswick (a little higher in Greater Moncton, a little lower in Fredericton and Saint John), while Newfoundland and Labrador is now at 10% year-over-year (a bit lower in St. John’s).
The MLS HPI provides the best way to gauge price trends because averages are strongly distorted by changes in the mix of sales activity from one month to the next.
The actual (not seasonally adjusted) national average home price was $716,585 in October 2021, up 18.2% from the same month last year. The national average price is heavily influenced by sales in Greater Vancouver and the GTA, two of Canada’s most active and expensive housing markets. Excluding these two markets from the calculation in October 2021 cuts over $155,000 from the national average price.
Print this page