Features
Harvesting
Logging Profiles
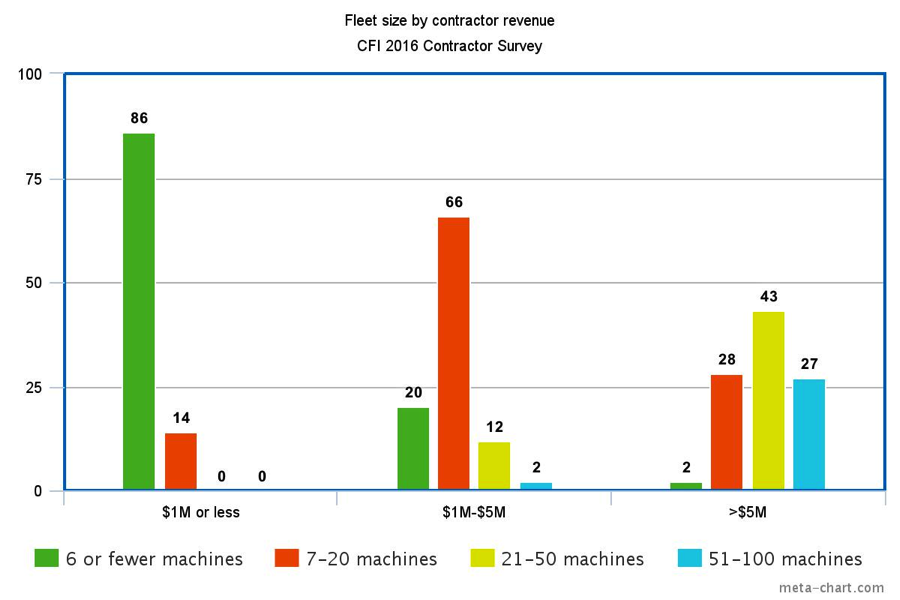
Survey Snippet #9 – Fleet size
Aug. 15, 2016 - While the survey sample was almost evenly split between loggers having less than 10 machines (47%) and those with more than 10 (51%), it should come as no surprise that we found a direct correlation between revenue and fleet size.
August 15, 2016 By Scott Jamieson
The bulk of the smallest companies ($1M or less in revenue) have six or fewer machines (86%), while the majority of mid-sized logging companies ($1M to $5M) have between seven and 20 machines (66%, with 12% having 21-50 machines).
In contrast, 68 per cent of the largest companies, those with over $5M in revenue, report owning 21 to 100 pieces of gear. Just one per cent of respondents reported having more than 100 machines.
The largest fleets tend to be in Ontario and the BC Interior (54% and 53% respectively own 21 or more machines), followed by the BC Coast and Alberta (35% and 36% with fleets with 21 or more machines). When it comes to the super fleets, Ontario rules as well, with 31 per cent reporting fleets of 51 to 100 machines, much higher than the BC Interior (19%), the BC Coast (9%) and Alberta (18%).
These fleet sizes will likely have an impact on succession planning, as the larger the fleet, the higher the cost of entry for the next gen of contractors. Barriers to entry appear to be far lower in Quebec and Atlantic Canada than anywhere west of Montreal.
Next week Survey Snippet #10 looks at fleet replacement and purchase expectations by company size and region.
Missed the last Survey Snippet #8 on working hours? See it here.
Find more news for the CFI 2016 Contractor Survey on www.woodbusiness.ca and in our enews in the coming months, with a final digital report in late August and a summary in the Sept/Oct print issue. Be sure to subscribe to the enews to get every item.
The survey was conducted in April 2016 for Canadian Forest Industries by independent research firm Bramm & Associates, generating over 230 replies to a detailed list of questions. Respondents were distributed according to the geographic breakdown of the forest industry, with 50 per cent in Western Canada, 25 percent in Quebec, and the rest found in Ontario, Atlantic Canada, and central Canada. Within BC responses were almost evenly split between the BC coast and Interior. Many thanks to our sponsors for making the research possible – Hultdins, Stihl, Tigercat and Ponsse. Also made possible with support from the Ontario Media Development Corporation (OMDC).
Print this page