Features
Harvesting
Logging Profiles
Survey Snippet #3 – Real world logging profits
July 5, 2016 – Last week’s snippet looked at what logging contractors saw as a fair profit margin for an established contractor (see report here). While expectations vary greatly by region, with expectations generally falling as you head east, the most popular answer was a profit margin in the 11 to 15 per cent range.
July 5, 2016 By Scott Jamieson
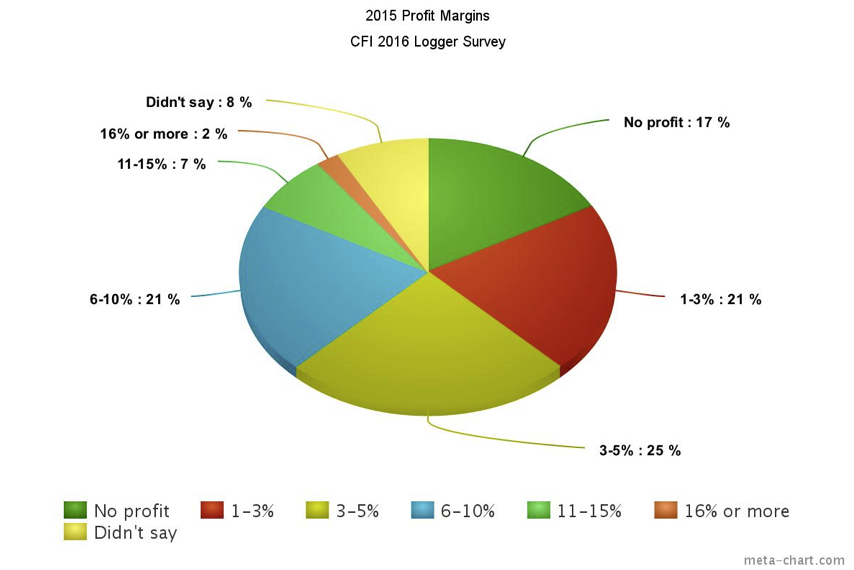
This week we look at how well that stacks up to reality. The national breakdown is seen in the chart below, with two-thirds making between one and 10 per cent profit margin, and 17 per cent making none at all. We defined profit margin as return on revenue as a percentage, or profit before income tax divided by total revenue. E.g. $5,000 of profit on $100,000 of revenue is a five per cent profit margin.*
 |
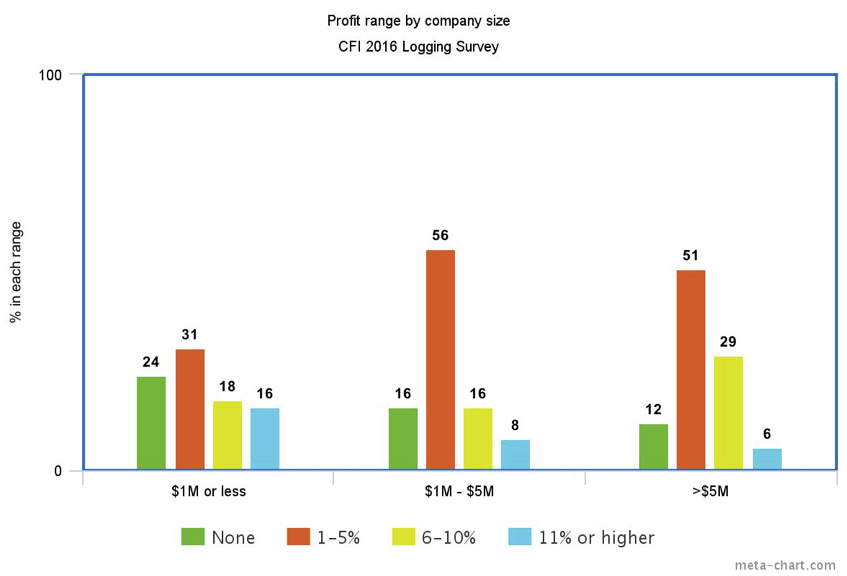
These averages hide a lot of diversity among companies of different sizes or in different locations. Almost a quarter (24%) of the smallest contractors, those with less than $1 million in annual revenue, report no profit at all in 2015, while half, or only 12 per cent of the largest contractors (>$5M) made the same claim. The U.S. magazine Timber Harvesting just reported its own survey findings this year, and found that 25 per cent of U.S. loggers reported no profit or a loss last year. On the other hand, 42 per cent reported pre-tax profits above seven per cent.
 |
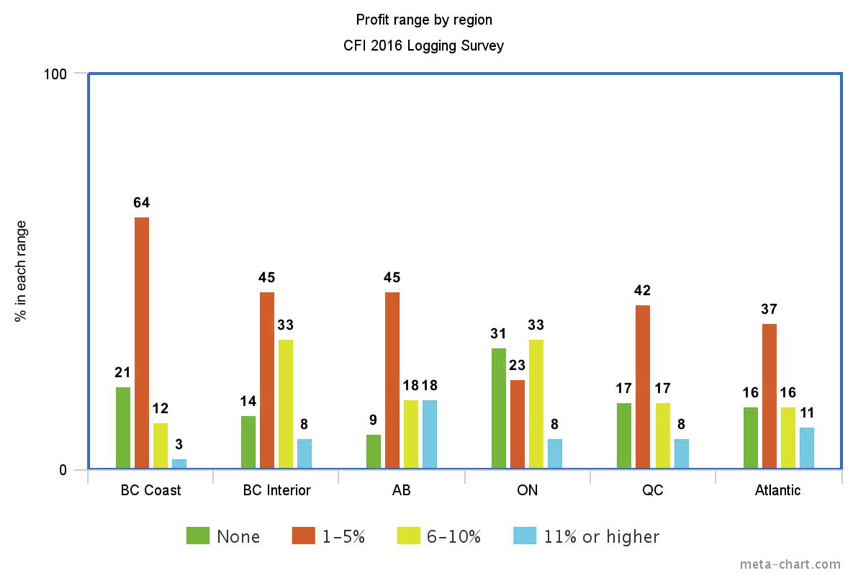
When it comes to region, Ontario fared the worst as far as profit, with almost one-third seeing no profit (31%), followed by the B.C. Coast (21%), Quebec (17%), Atlantic Canada (16%), B.C. Interior (14%) and Alberta (9%). A full half of Coastal loggers report a profit of less than three per cent and 85 per cent report a margin of five per cent or less – both the largest showing of all regions in these ranges. In contrast, only 28 and 59 per cent of Interior contractors reported profits in these ranges.
 |
*Editor’s note: An earlier version of this article incorrectly defined profit as the per cent of EBITDA (earnings before income tax, debt and amortization) versus total revenue. It has since been corrected according to how the survey question was worded to define profit. We rely on respondents to accurately report their profit numbers.
Next week we’ll look at how the profit picture has changed for contractors over the past three years.
Look for more news for the CFI 2016 Contractor Survey on www.woodbusiness.ca and in our enews in the coming months, with a final digital report in August and a summary in the Sept/Oct print issue. Be sure to subscribe to the enews to get every item.
Missed Survey Snippet #2 – What’s fair contractor profit? Read it here.
The survey was conducted in April 2016 by independent research firm Bramm & Associates, generating over 230 replies to a detailed list of questions. Respondents were distributed according to the geographic breakdown of the forest industry, with 50 per cent in Western Canada, 25 per cent in Quebec, and the rest found in Ontario, Atlantic Canada, and central Canada. Within BC responses were almost evenly split between the BC coast and Interior. Many thanks to our sponsors for making the research possible – Hultdins, Stihl, Tigercat and Ponsse. Also made possible with support from the Ontario Media Development Corporation (OMDC).
Print this page